Using Amazon Global Accelerator to improve cross board request improvement
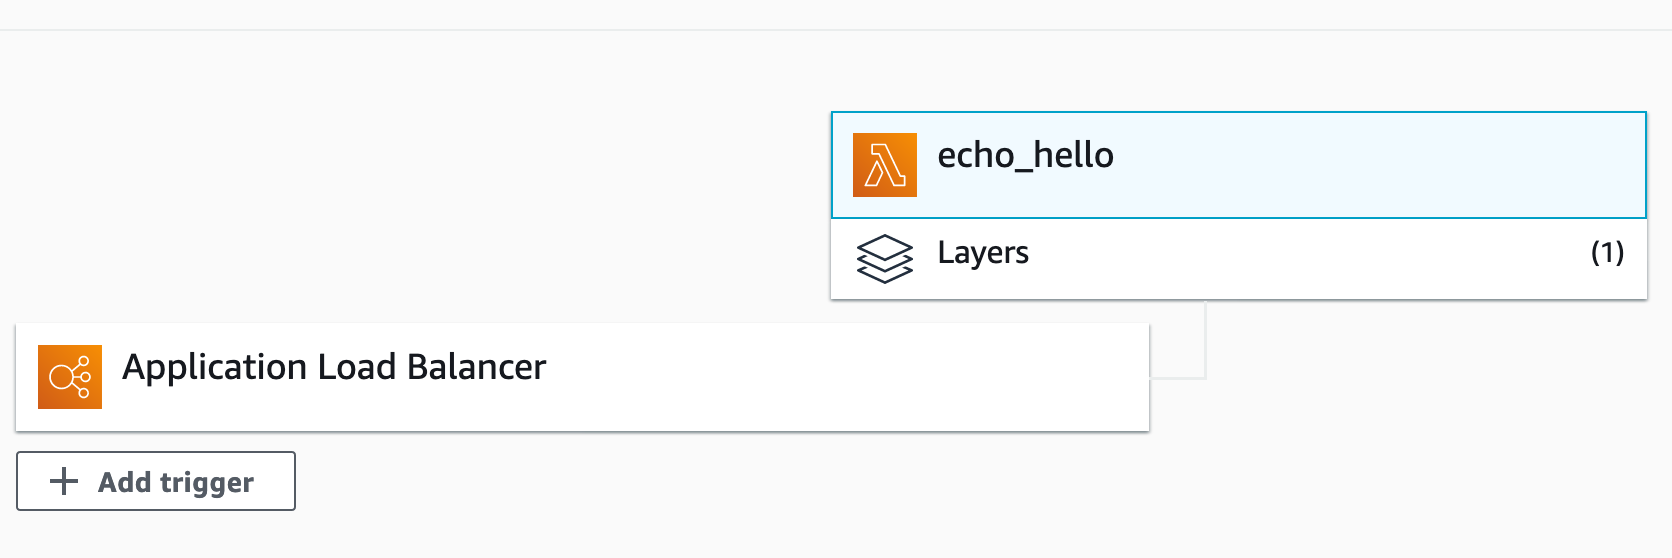
- Create the lambda funtion
echo_helloin eu-west-1 region ```python import json import urllib import boto3 from botocore.vendored import requests
def lambda_handler(event, context): myip = requests.get(‘http://checkip.amazonaws.com’).text.rstrip() print(myip) return { ‘statusCode’: 200, ‘body’: json.dumps(‘Hello from Lambda!’ + myip) }
2. Configure the Lambda functions as a target for an Application Load Balancer

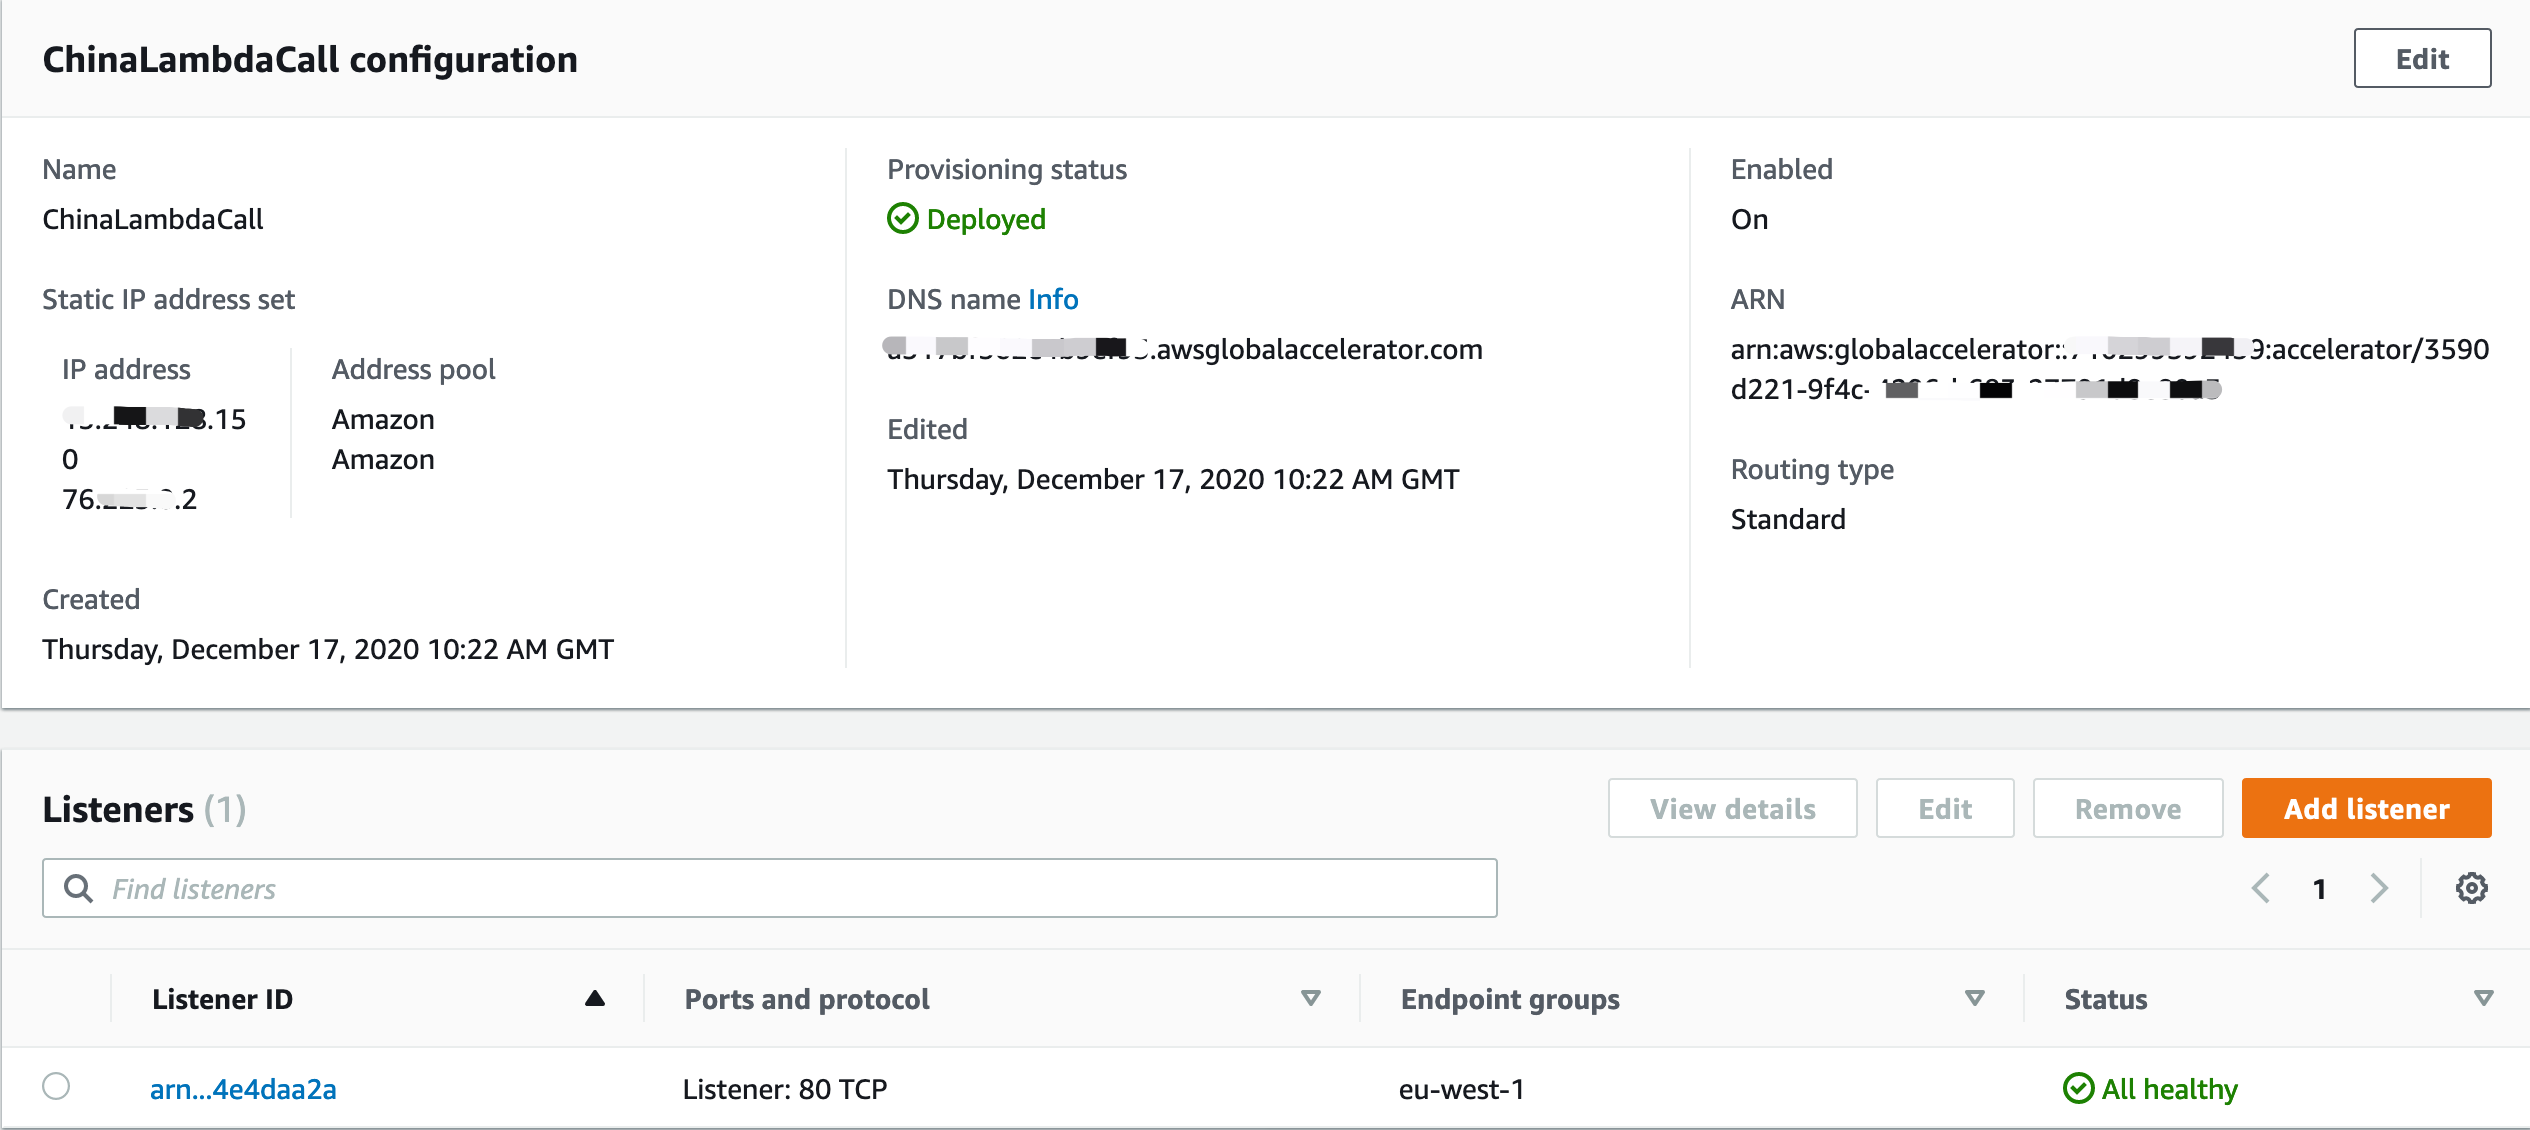
3. Configure the Amazon Global Accelerator with endpoint to Application Load Balancer


4. Create the lambda funtion `invokeGlobalLambda` in cn-north-1 region
The [source code](/aws-is-how/network/aga/script/lambda_function.py)

```bash
pip install -r requirements.txt --target ./package
cd package
zip -r ../my-deployment-package.zip .
cd ..
zip -g my-deployment-package.zip lambda_function.py
aws lambda update-function-code --function-name invokeGlobalLambda --zip-file fileb://my-deployment-package.zip --region cn-north-1
aws lambda invoke --function-name invokeGlobalLambda \
--region cn-north-1 --log-type Tail \
--query 'LogResult' --output text hello-output.txt | base64 --decode
- Enable AWS Lambda with AWS X-Ray
aws lambda update-function-configuration --function-name invokeGlobalLambda \ --tracing-config Mode=Active --region cn-north-1 - Run performance testing with Apache AB ```bash ab -n 10000 -c 10 -s 360 https://myapi.execute-api.cn-north-1.amazonaws.com.cn/dev/invokeGlobalLambda
Concurrency Level: 10 Time taken for tests: 1596.488 seconds Complete requests: 10000 Failed requests: 8400 (Connect: 0, Receive: 0, Length: 8400, Exceptions: 0) Total transferred: 3985579 bytes HTML transferred: 1115579 bytes Requests per second: 6.26 [#/sec] (mean) Time per request: 1596.488 [ms] (mean) Time per request: 159.649 [ms] (mean, across all concurrent requests) Transfer rate: 2.44 [Kbytes/sec] received
Connection Times (ms) min mean[+/-sd] median max Connect: 24 44 80.8 31 2210 Processing: 1347 1549 394.4 1516 16160 Waiting: 1347 1549 394.3 1515 16160 Total: 1373 1594 409.9 1551 16190
Percentage of the requests served within a certain time (ms) 50% 1551 66% 1567 75% 1579 80% 1589 90% 1625 95% 1676 98% 1845 99% 2536 100% 16190 (longest request) ```
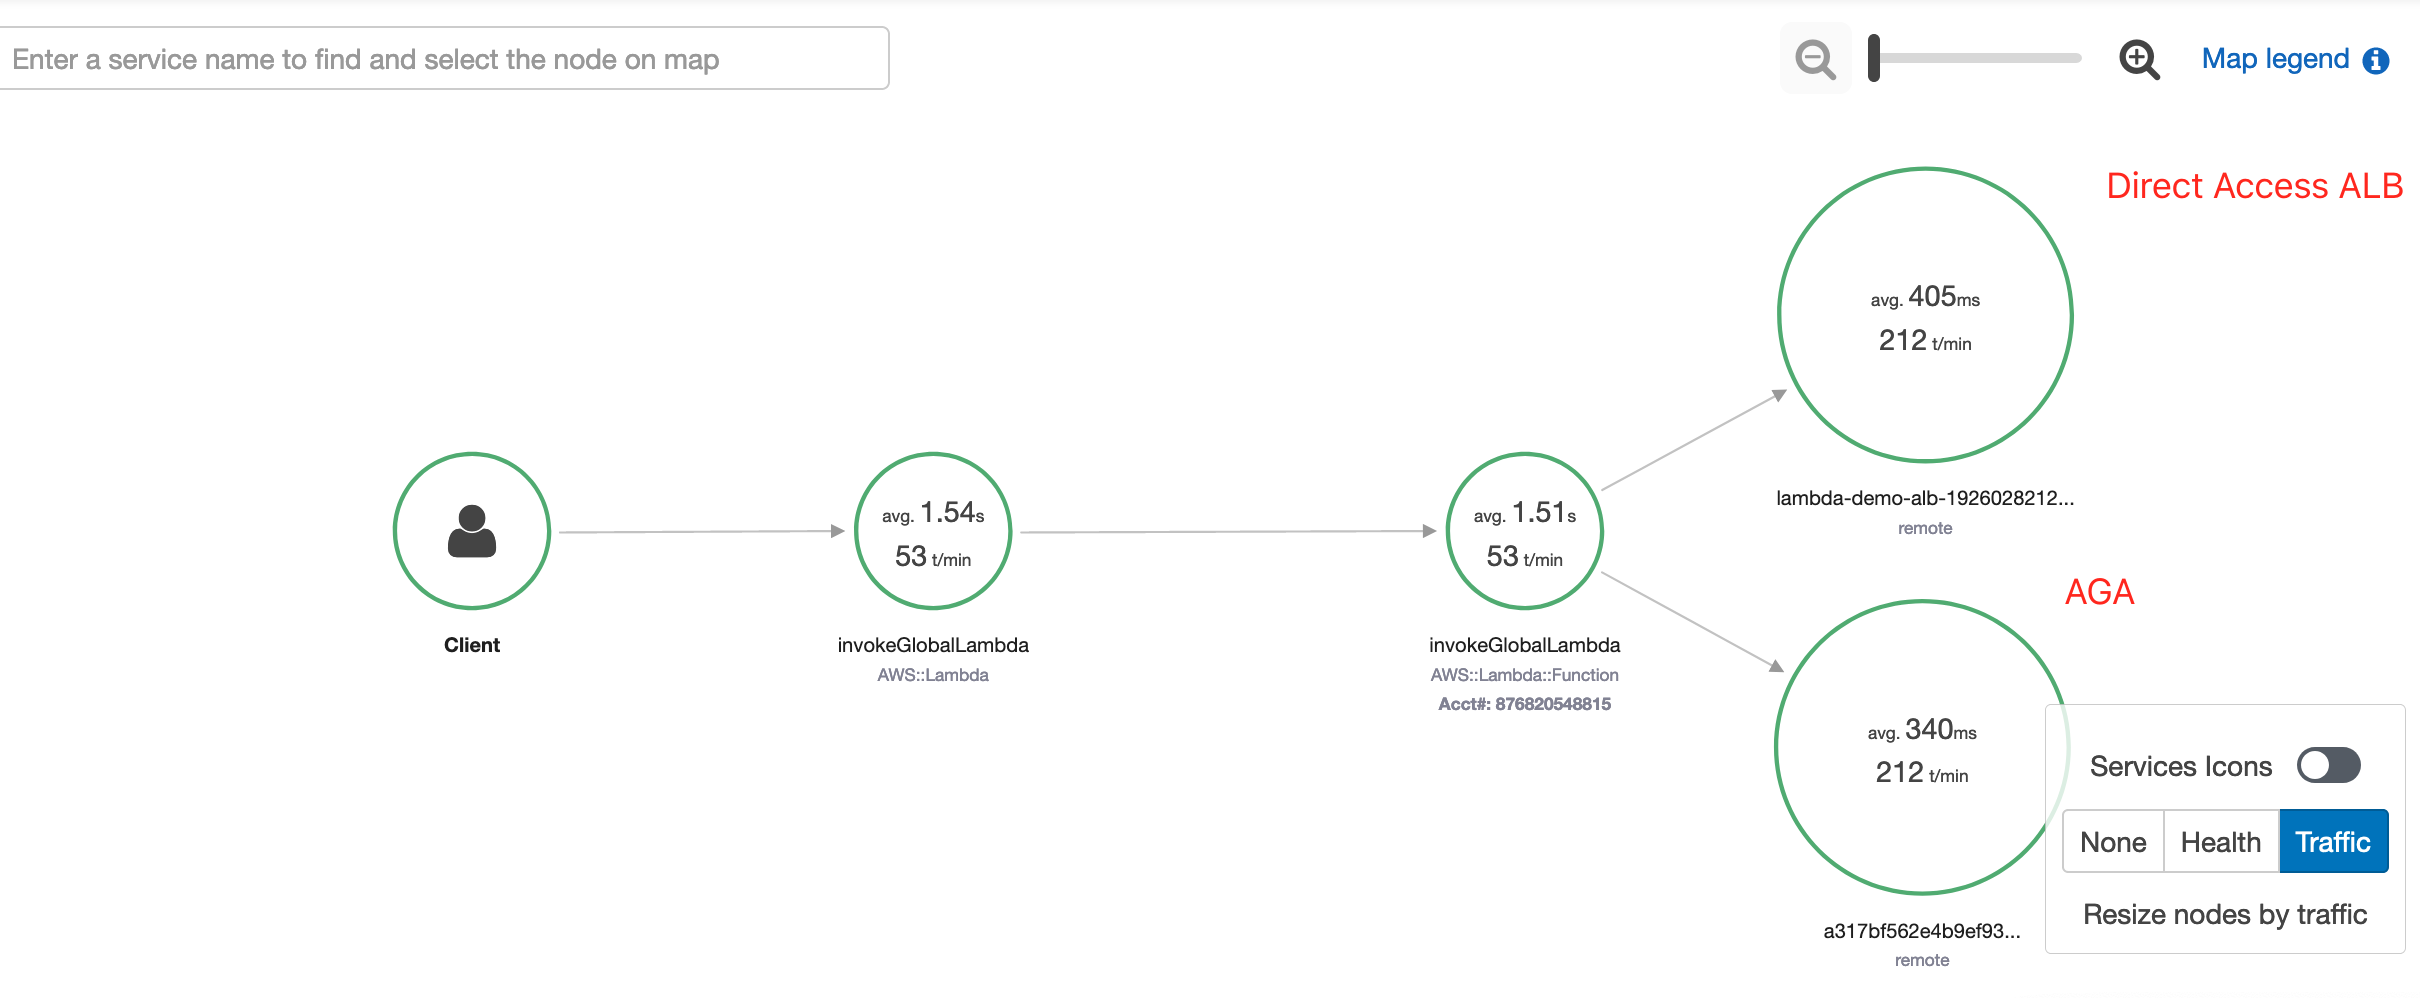
- Check the invocation performance in X-Ray
